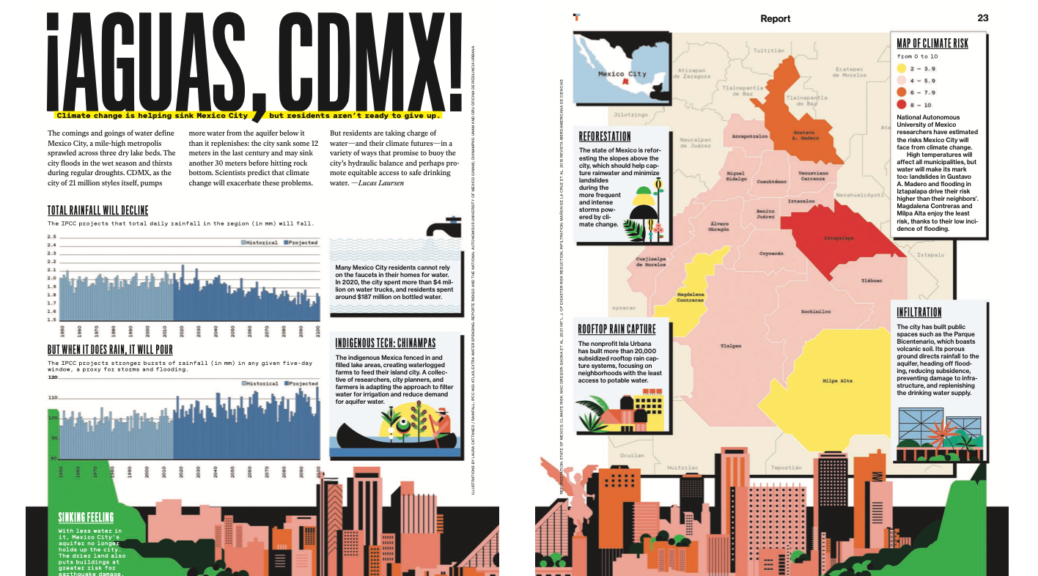
This is my first piece of data visualization journalism in a long time. It was fun to work with the editors and illustrator to bring it together. It’s also great to cover a topic near to my heart and the part of my family that live in Mexico City. Someday I’d like to report more on the social side of Mexico’s water situation.
Meantime, I recommend checking out the print edition of Technology Review [pdf] to see the spread but there is also an online version for subscribers.